
Is Housing Inventory Rising in Massachusetts? Oct 2026
Read this article in Azərbaycanca · Türkçe
TL;DR
- Yes: Massachusetts had 15,119 homes for sale at the end of October 2026, up 25% from 12,074 a year earlier.
- Inventory is still 22% below the 2018-2019 October average, or 27% below when adjusted for household growth.
- Massachusetts has the smallest gap to pre-pandemic inventory in New England, but the region remains among the tightest in the country.
Yes. Housing inventory in Massachusetts is rising faster than in almost any other state: 15,119 homes were for sale at the end of October 2026, up 25% from 12,074 a year earlier. The catch is that the state is still well short of normal, with about 22% fewer listings than its pre-pandemic October average.
So the honest answer to "is housing inventory rising in Massachusetts" is yes, meaningfully, but from a very low base. Every figure below comes from ResiClub's analysis of Realtor.com listing data, published by Lance Lambert on November 11, 2026, which tracks the active listings on the market at the end of each month.
Is Housing Inventory Rising in Massachusetts? The October Numbers
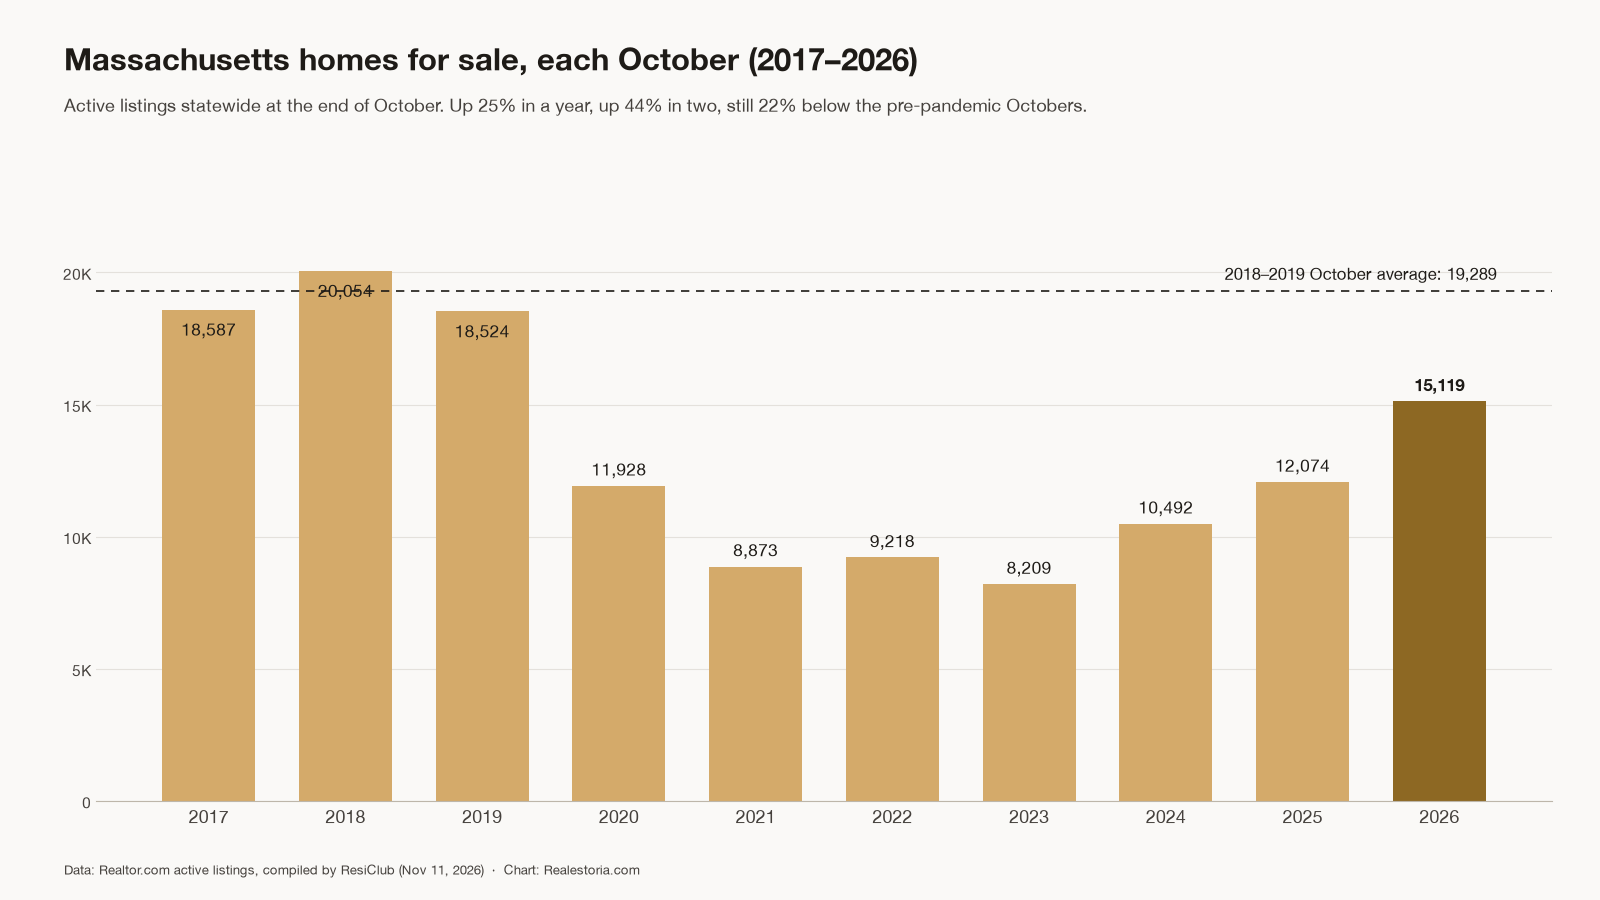
Comparing October to October strips out the seasonal swing that makes spring look busy and winter look empty. Here is the statewide count of active listings at the end of each October:
- 2017: 18,587
- 2018: 20,054
- 2019: 18,524
- 2020: 11,928
- 2021: 8,873
- 2022: 9,218
- 2023: 8,209
- 2024: 10,492
- 2025: 12,074
- 2026: 15,119
The bottom came in October 2023 at 8,209. Since then the count has climbed three years running, and October 2026 sits 44% above the level of two years ago. The 25% one-year gain is among the fastest in the country. Only Minnesota at 31% and Virginia at 26% rose faster.
Now the other side. The 2018-2019 October average was 19,289, so today's count is 22% below that baseline. ResiClub prefers to measure per 1,000 households, because more households now compete for each listing, and on that basis Massachusetts is 27% short.
The net result: more homes are for sale than in any October since 2019, but still roughly 3,400 fewer than October 2019 and about 4,900 fewer than October 2018.
How Massachusetts Compares With New England and the U.S.
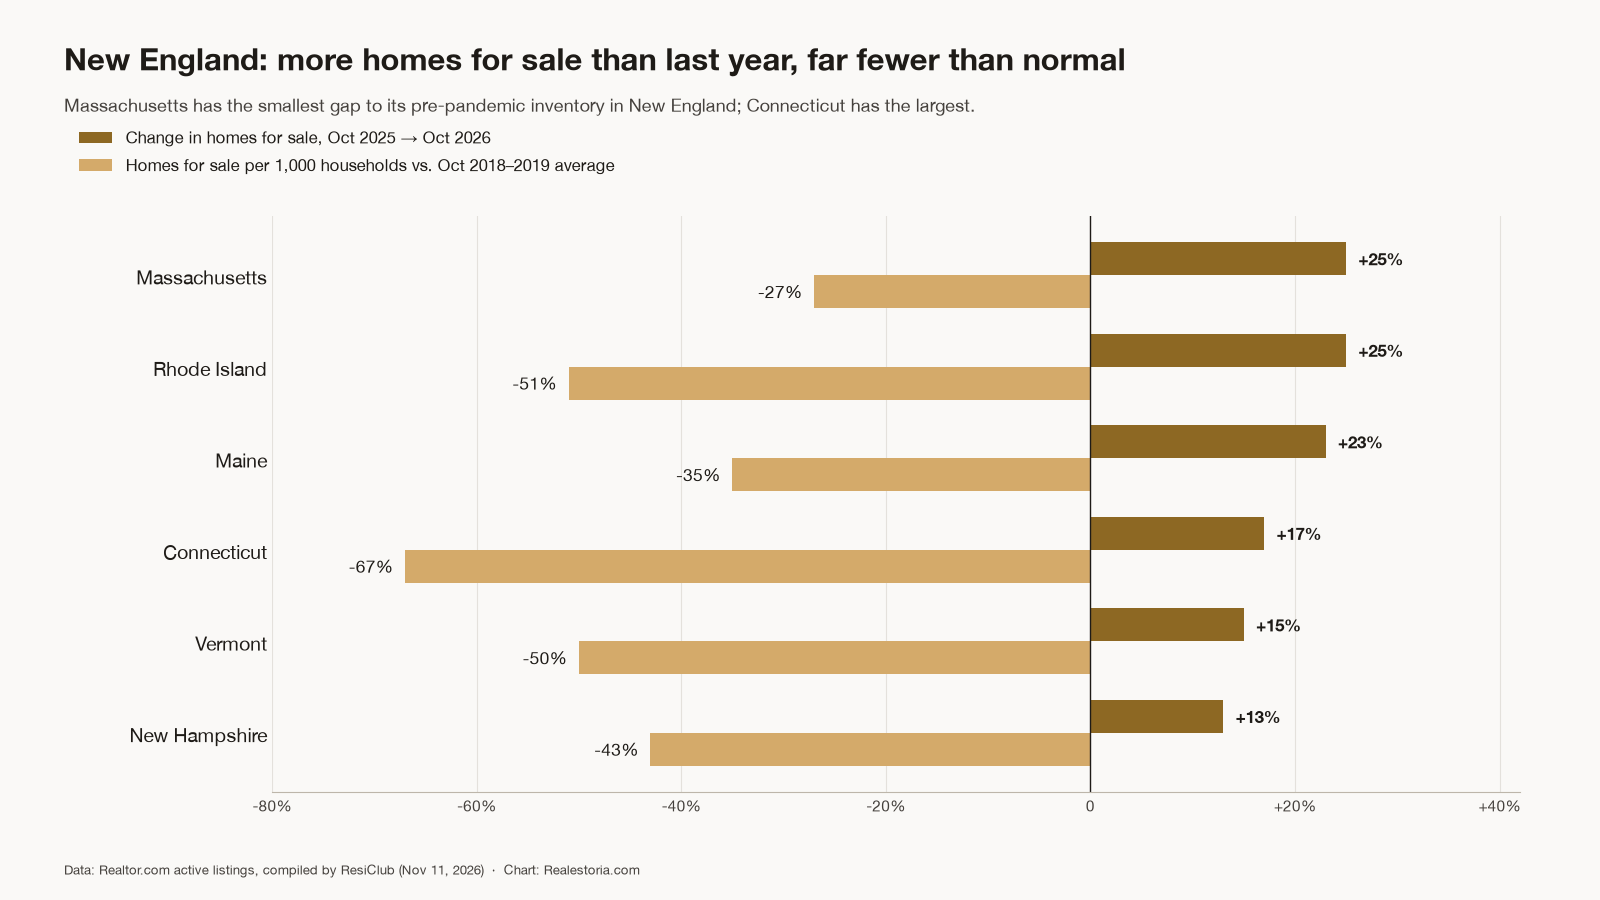
The whole region is rising, and the whole region is still tight. Here is each neighbor's one-year change, its gap to 2018-2019 inventory per household, and its October 2026 count:
- Connecticut: up 17%, 67% below normal (the largest gap in the country), 6,232 homes
- Rhode Island: up 25%, 51% below, 2,093 homes
- Vermont: up 15%, 50% below, 2,880 homes
- New Hampshire: up 13%, 43% below, 3,779 homes
- Maine: up 23%, 35% below, 6,528 homes
Massachusetts, at 27% below, has the smallest gap in New England. That is a relative statement. Alongside parts of the Midwest, the Northeast remains among the tightest housing markets in the U.S.
Nationally, active listings reached 1,183,520 at the end of October, up 7.6% from 1,100,001. That is 83,519 more homes, a smaller gain than the 146,187 added the year before. Still, annual growth has accelerated four months in a row after slowing to 1.9% in June. National inventory is 2.1% below October 2019 and still below October 2018.
Ten states, including Texas, Arizona, Colorado and Washington, plus DC, are now above pre-pandemic inventory per household. Florida inventory is down 8% year over year as its correction eases. ResiClub ties the renewed softening partly to mortgage rates hovering just under a two-year high, and notes that price growth running below income growth is slowly repairing affordability.
What Rising Listings Mean for Buyers, Sellers and Investors
Buyers. This is the most choice in a fall market since 2019, and homes that have sat for a few weeks leave more room to negotiate on price, credits or timing. But more than last year is not plenty. With inventory 22% short of normal, a well-priced single-family in the inner suburbs can still draw multiple offers. In practice, the price band matters more than the statewide headline: entry-level homes near transit tend to stay competitive while higher-priced listings hand buyers more bargaining power. If you are buying for the first time, the first-time buyer guide covers the steps and programs worth knowing.
Sellers. Price against the homes you compete with today, not against spring 2025 comps. Buyers now compare more options in a single weekend, so the distance between a correctly priced home and an aspirational one shows up quickly in showings and days on market. A pre-list value estimate grounded in current competition is the cheapest insurance against a stale listing. Some owners, especially those who want privacy or certainty, prefer a quiet off-market sale when public competition rises. That trades some exposure for control, and it is not the right fit for everyone.
Small investors. More listings and longer decision windows usually mean more negotiated deals, particularly on properties that need work or show weaker rent math at current rates. The numbers still have to work at today's financing costs, so underwrite conservatively. The investor guide walks through how to evaluate Greater Boston rentals.
What the Statewide Number Cannot Tell You
A single statewide count hides a lot. It mixes Boston condos with Western Massachusetts single-families, and a 25% rise could be concentrated in a few segments or towns. It also captures one day a month, so a wave of late-October listings or pendings can nudge it either way.
It does not tell you prices, days on market or how many listings are stale versus fresh. Before making a decision, look at the specific town and property type you care about. The Greater Boston town pages are a better starting point than any statewide figure, and recent sales in your target neighborhood will tell you more than a headline percentage.
Bottom Line
Massachusetts inventory is rising quickly, up 25% in a year, but it remains about a fifth below pre-pandemic levels, so the market is looser rather than loose. Buyers have more choice and room to negotiate, while sellers who price to today's competition still do well. If you want to see where your own home stands in this market, a home value estimate is a good first step.
Common Questions
Is Massachusetts inventory back to pre-pandemic levels?
No. October 2026 had 15,119 active listings versus a 2018-2019 October average of 19,289, a 22% shortfall. Adjusted per 1,000 households, the gap is 27%. That is roughly 3,400 fewer homes than October 2019, according to ResiClub's analysis of Realtor.com data.
How does Massachusetts compare with the rest of New England?
Massachusetts is closest to normal in the region. Per household, Connecticut sits 67% below its pre-pandemic level, Rhode Island 51%, Vermont 50%, New Hampshire 43% and Maine 35%, while Massachusetts is 27% below. Its 25% one-year gain ties Rhode Island for the fastest in New England.
Is national housing inventory rising too?
Yes, but more slowly. U.S. active listings reached 1,183,520 at the end of October 2026, up 7.6% from a year earlier. Annual growth has accelerated four months in a row, from 1.9% in June, yet national inventory remains 2.1% below October 2019.
Plato Asadov (Aflatun Asadov)
Licensed Massachusetts Real Estate Salesperson, Lic. #9579004
Brokered by Steve Bremis Realty Group. Equal Housing Opportunity.
Phone: 617-302-7222 · Email: plato@realestoria.com · realestoria.com
Work with Plato · Get a home value estimate · Contact
This article was drafted with AI assistance from Plato's research tools and reviewed by Plato before publishing. Information deemed reliable but not guaranteed; it is general education, not advice for your specific situation.
Share this article
Plato Asadov
Real Estate Agent | Investor
Real estate pro with 6+ years selling Greater Boston homes. I share what I've learned about buying, selling, and investing.
Work with Plato →LinkedIn